Back to Lecture Thumbnails

rmjones

yonkus
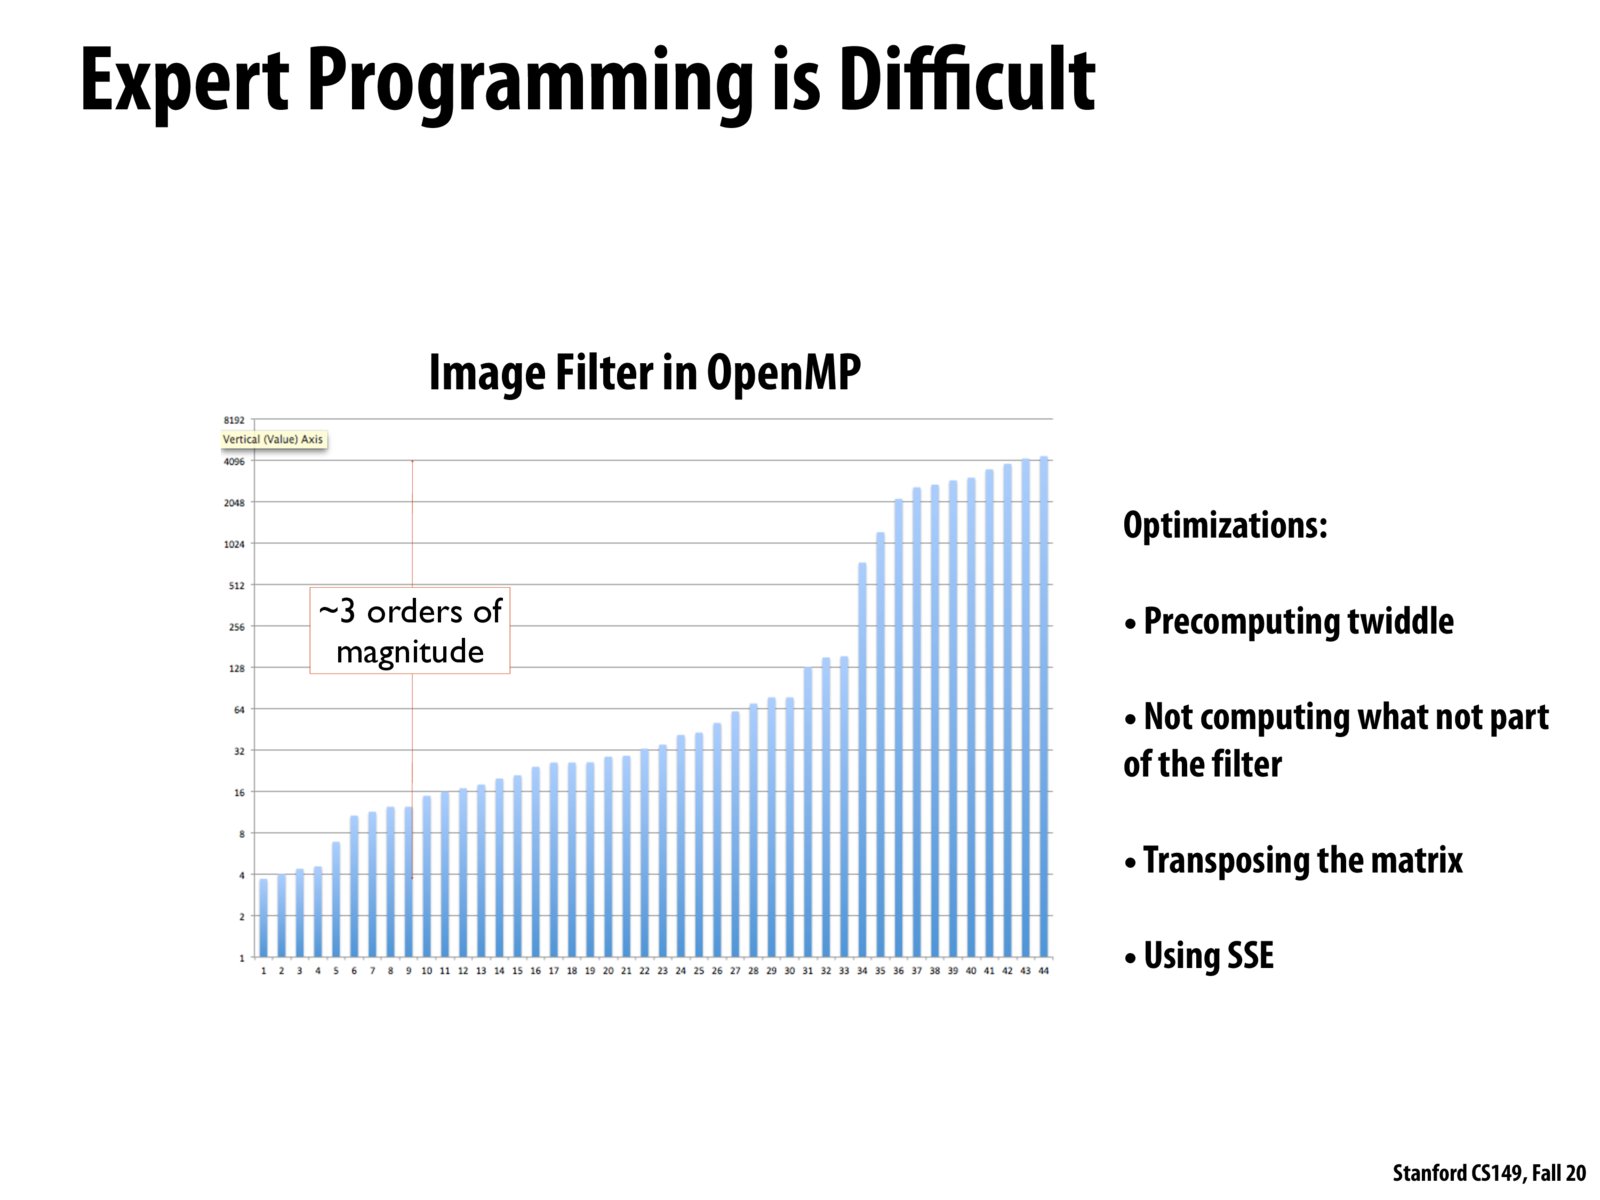
What does the Y Axis represent? I understand abstractly that higher is better and that it's a logarithmic scale, but what does the number 4 or 8 or 16 actually mean?
Please log in to leave a comment.
This graph was taken from a previous iteration of CS 149 which tracked student performances for a particular assignment. The gap in best to worst performance is about 3 orders of magnitude! The takeaway is that even for very bright Stanford students, imperatively implementing a fully-optimized program is quite difficult.